Bioinformatics
Clustering Analysis
Clustering Analysis Overview
Shed light on the intricate relationships among samples or metabolites by revealing how groups of samples or metabolites are interrelated. Our clustering analysis tool intelligently identifies the optimal grouping parameters, making the analysis more accessible.
Clustering is a staple method in the field of data analytics and bioinformatics, used for grouping entities based on their similarities. This technique is crucial in revealing the inherent structures within data, often leading to insightful discoveries in various scientific domains. Grasping the nuances of clustering can significantly enhance your understanding of your data’s hidden patterns and relationships.
Demo the Bioinformatics Platform
Explore, interpret, and elucidate the biological impact of your samples using publication-ready tools.
Clustering Analysis within Our Bioinformatics Platform
In metabolomics, clustering is a powerful method used to organize both metabolites and samples into meaningful groups. It reduces complexity and guides focused, hypothesis-driven research, offering a clearer view of the metabolic landscape and its implications for health and disease.
Pathway Insights
Metabolites that are clustered together often participate in the same or related metabolic pathways. By observing which metabolites co-cluster, researchers can infer their involvement in common biochemical processes. For instance, if a group of amino acids clusters together, it might indicate their collective role in protein synthesis or degradation pathways.
Biomarker Discovery
Groups of metabolites that cluster in specific conditions might be potential biomarkers, aiding in disease understanding and treatment.
Hypothesis Generation
Clusters can prompt hypotheses about biological processes, guiding further targeted research. In addition, samples can also be clustered for further analysis.
Phenotype Characterization
Grouping related samples based on metabolic profiles can help distinguish phenotypes or conditions.
Response Patterns
Clustering samples helps identify common response patterns to treatments or environmental changes, providing insights into system dynamics.
A User-Friendly Experience
Variety of Clustering Algorithms
Access a range of algorithms including K-means, hierarchical, and DBSCAN, each suited for different types of data and research questions.
Interactive Visualizations
Dynamic and interactive visualizations allow you to explore the clusters and their characteristics, thereby enhancing understanding and interpretation.Integration with Other Analyses
Seamless integration with other tools in the platform, such as volcano analysis, allows you to explore the resulting clusters with other analytical approaches.
Clustering Features
Hierarchical Clustering (HC)
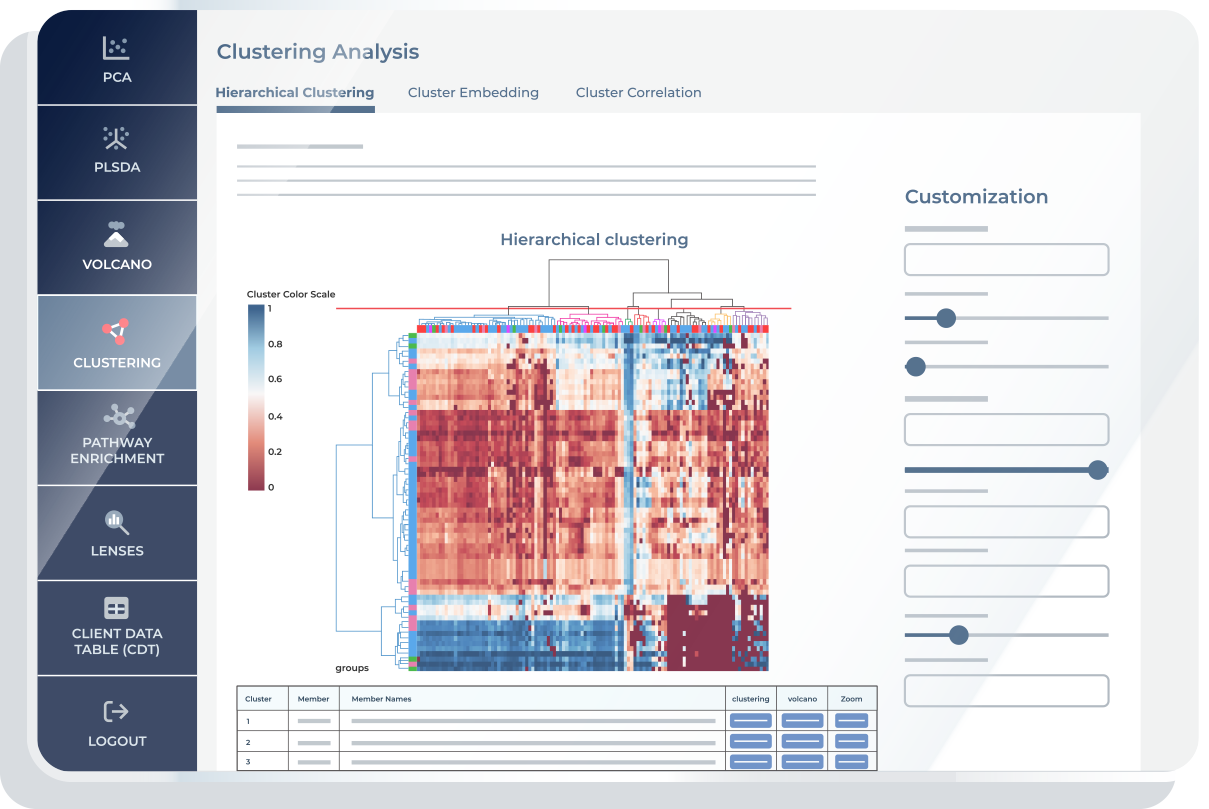
Hierarchical clustering in our platform allows for the clustering of both metabolites and samples. Hierarchical clustering is a cluster analysis method that identifies relationships between the elements (metabolites or samples) in the clusters. This dual functionality is important for analyzing different aspects of metabolomics data. Depending on what is chosen for analysis, the heatmap displays the intensities of metabolites or samples. Clustering metabolites can reveal patterns in biochemical relationships and pathways while clustering samples can help in understanding variations across different conditions or phenotypes.

Cluster Embedding
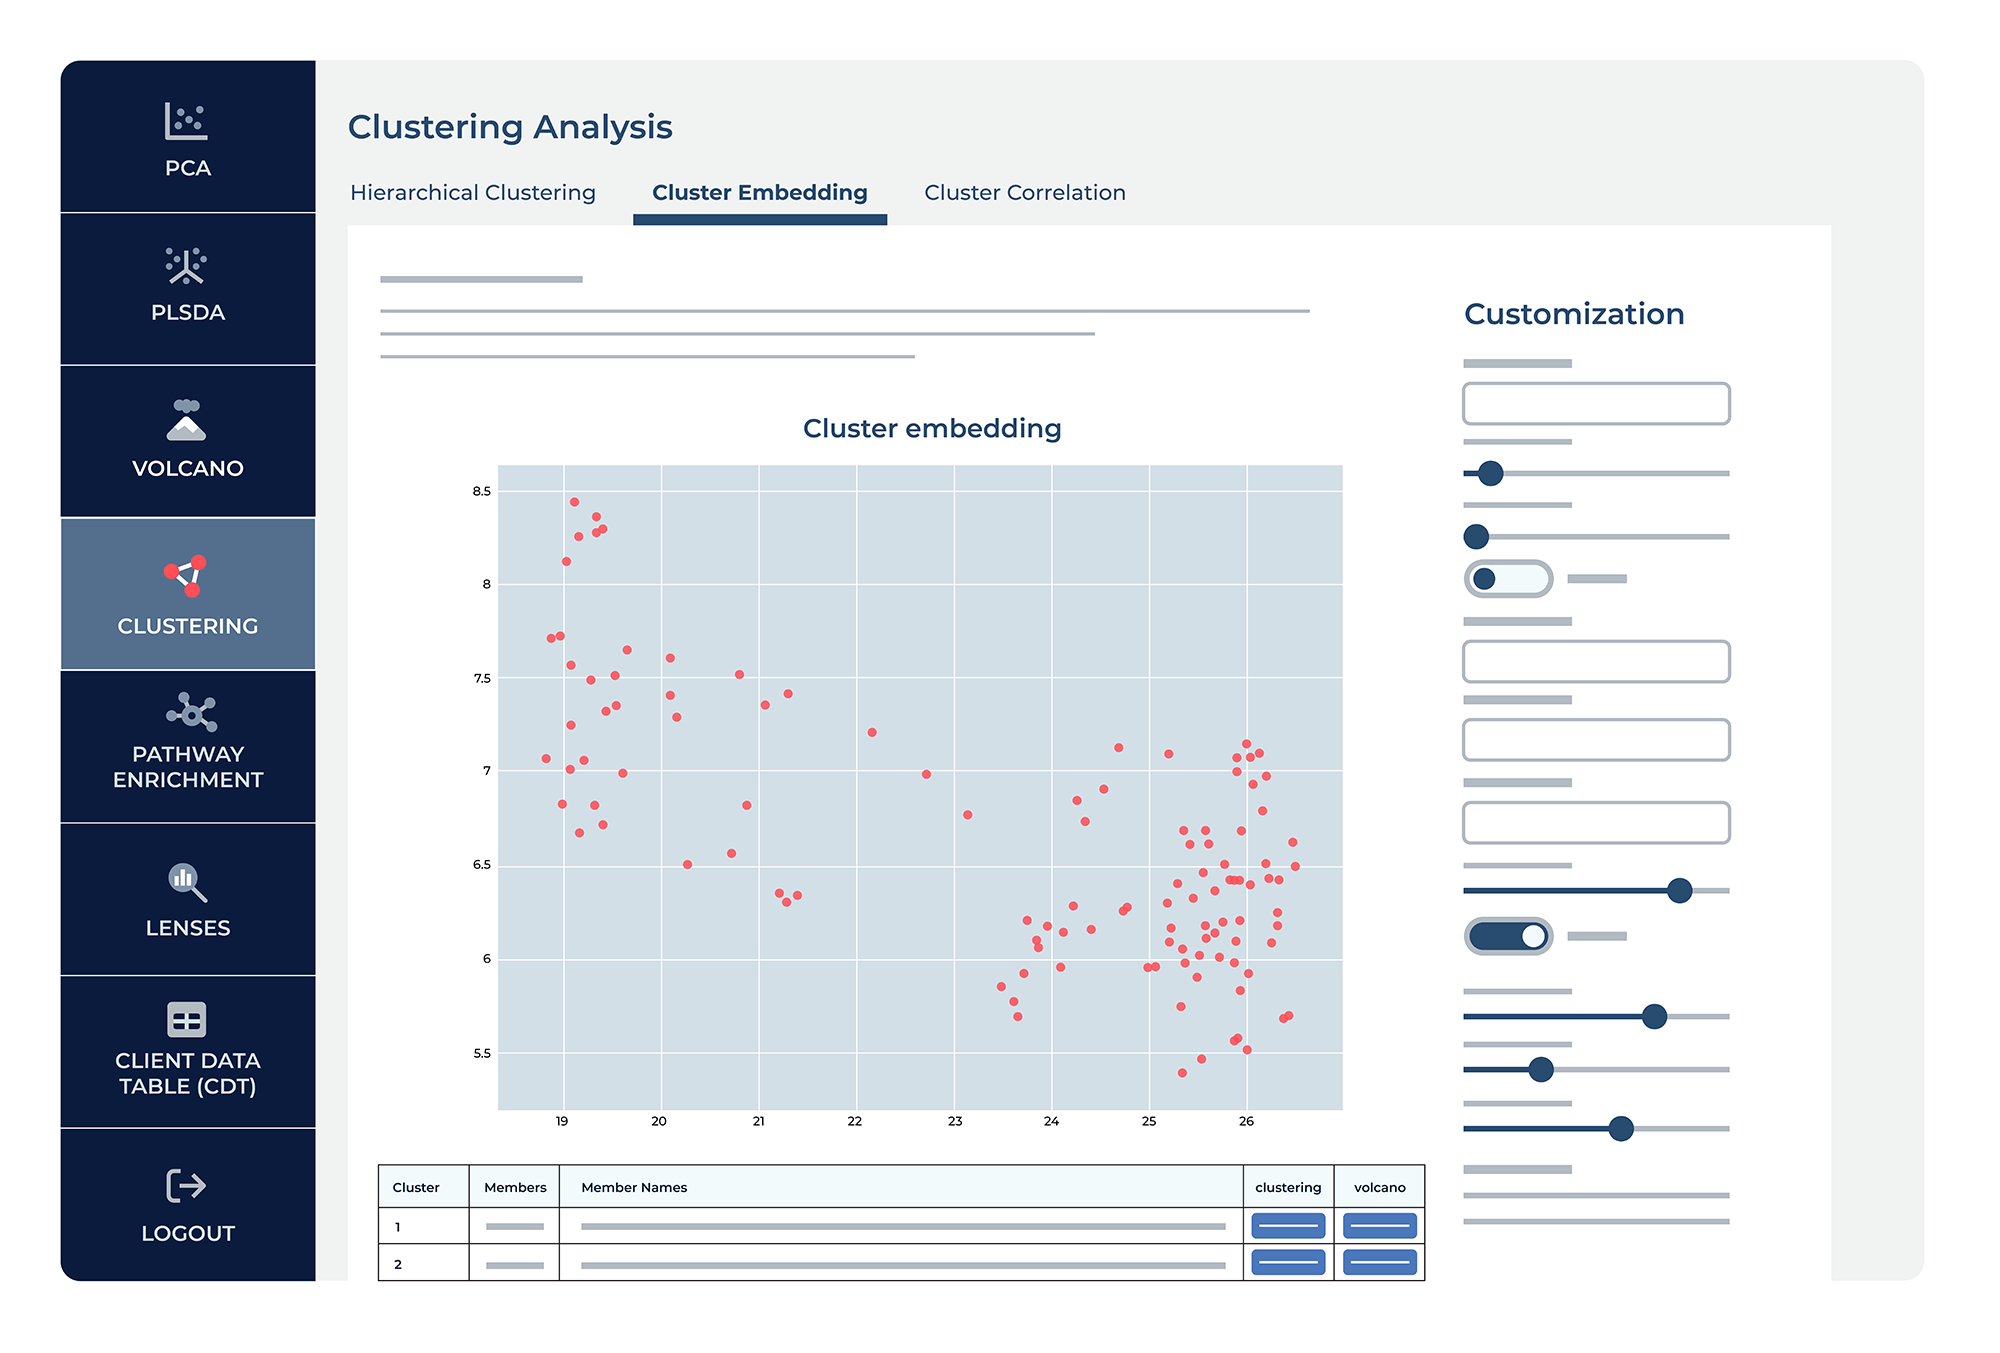
Embedding is the process of representing something in a computer. Cluster embedding is a technique that reduces the dimensionality of data. By converting the metabolomics data to numbers that the computer can analyze, the complexity of the data is reduced. Unlike hierarchical clustering, embedding focuses on representing the data in a way that may reveal patterns not immediately observable in the raw dataset, potentially revealing subtypes within conditions or diseases. This approach is particularly advantageous in metabolomics, where the high-dimensional nature of the data can obscure underlying patterns when viewed in its raw form.

Cluster Correlation
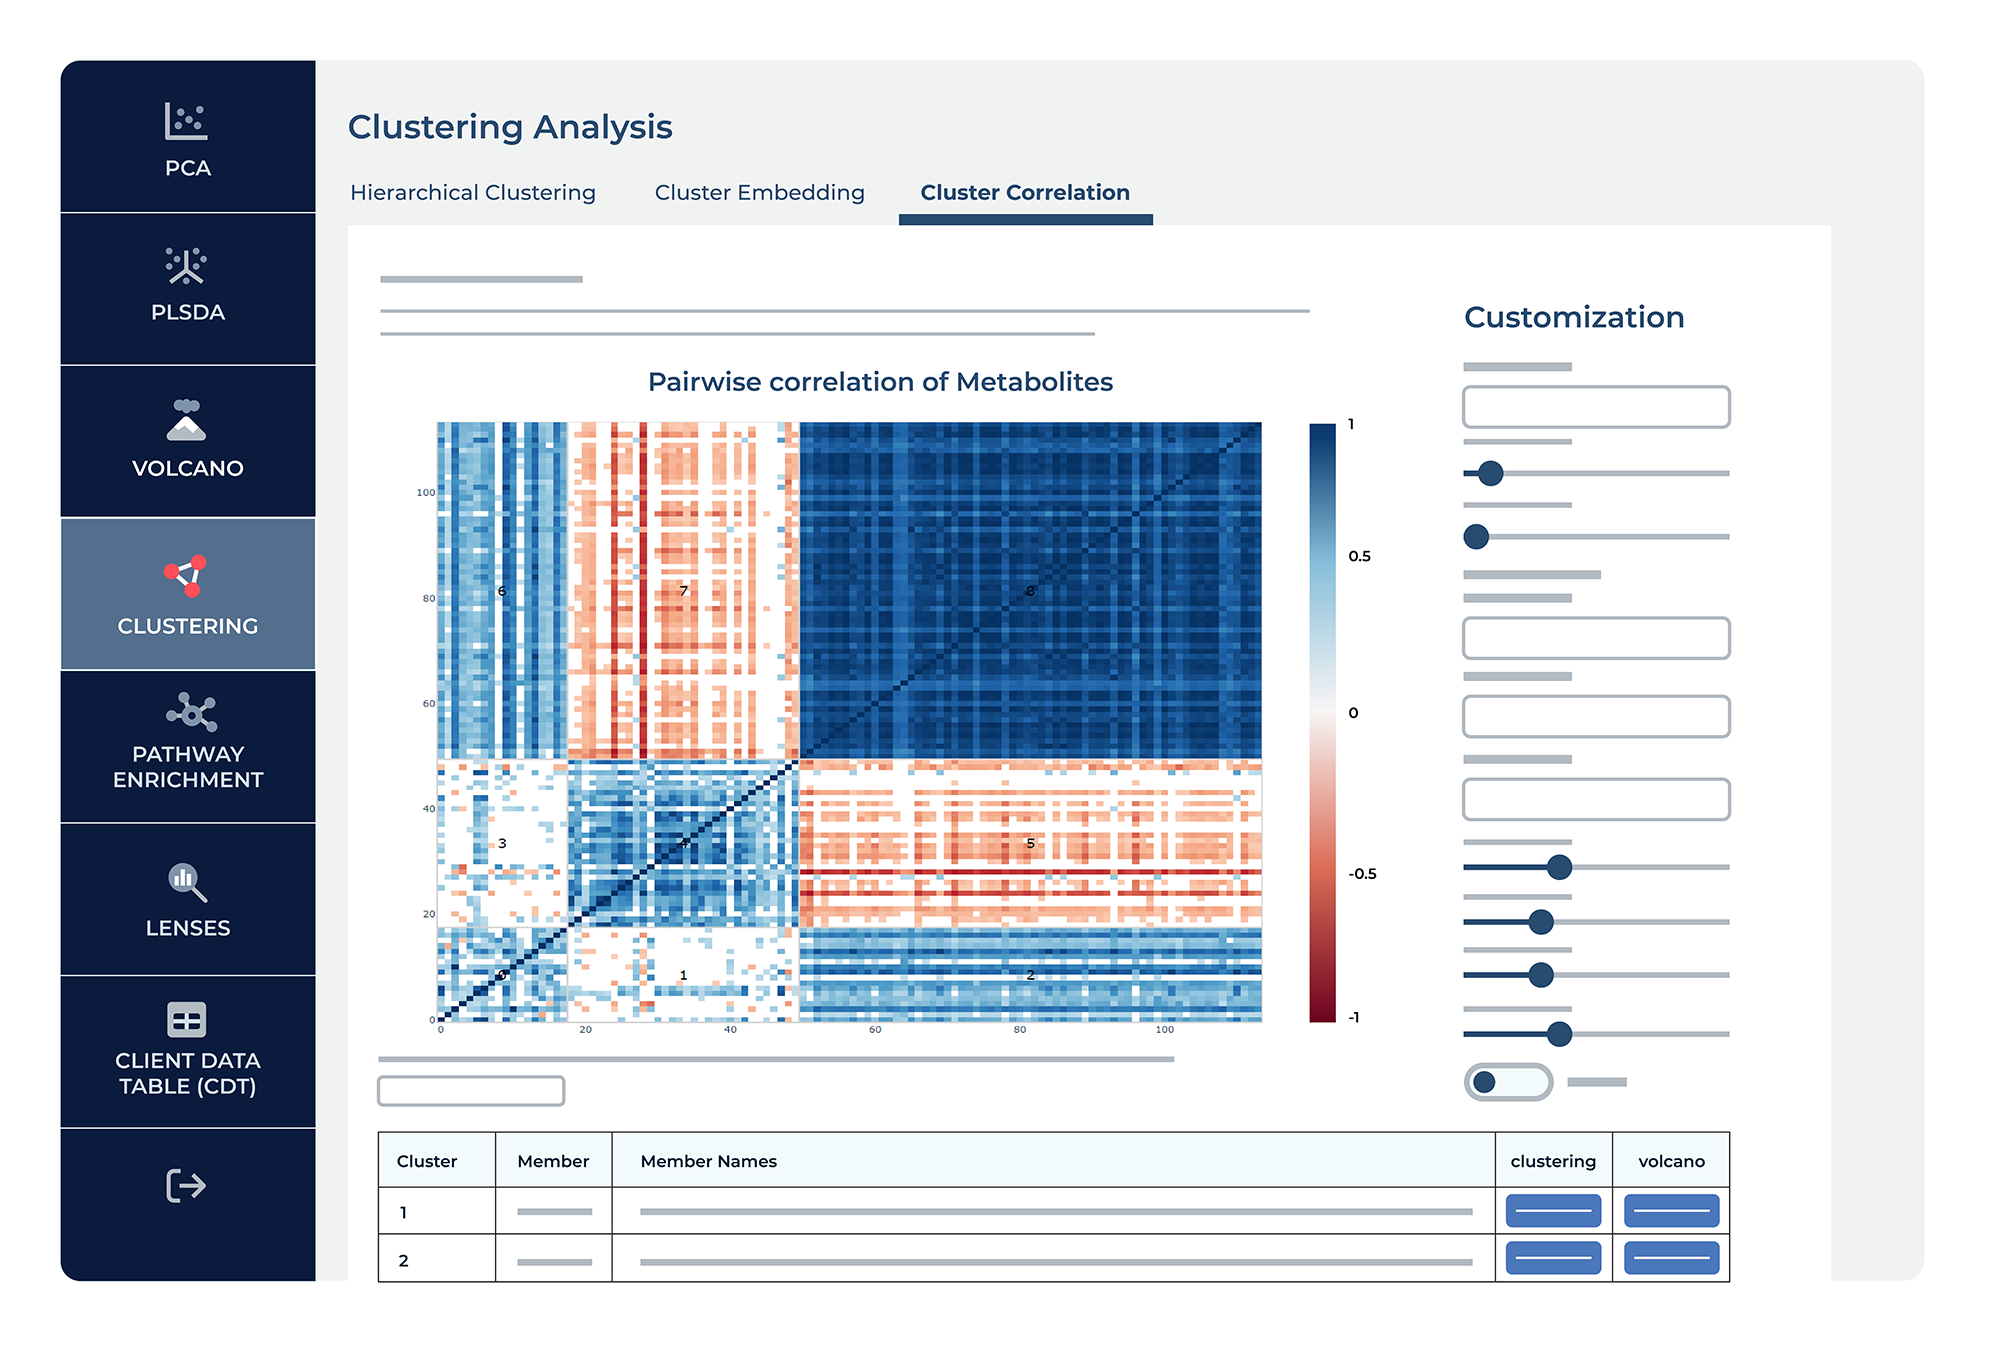
The cluster correlation feature in Metabolon’s Bioinformatics Platform extends the clustering analysis by incorporating correlation metrics to evaluate the relationships between metabolites or samples. This feature is vital for identifying co-regulation and potential interactions within the metabolomics data.
Initially, the tool computes a pairwise correlation matrix, assessing the degree to which metabolites or samples vary together across different conditions. This step is foundational as it quantifies the strength and direction of the relationships. Following the correlation analysis, the Spectral bi-clustering algorithm1 is applied. This technique is designed to simultaneously cluster rows and columns, thereby identifying homogeneous blocks within the matrix—groups of metabolites or samples with similar correlation patterns.
When visualizing the results, you can interact with the correlation matrix, adjusting parameters such as the correlation coefficient threshold to refine the granularity of the bi-clusters. Visual tools include heatmaps that provide an intuitive way to interpret the correlation data. The resulting bi-clusters are also overlaid on the heatmap to easily determine which points in the correlation matrix belong to which cluster.

References
1. Kluger, Yuval, et al. “Spectral biclustering of microarray data: coclustering genes and conditions.” Genome research 13.4 (2003): 703-716.
Bioinformatics Platform
Share this page
Demo Our Bioinformatics Platform For Free.
Contact Us
Talk with an expert
Request a quote for our services, get more information on sample types and handling procedures, request a letter of support, or submit a question about how metabolomics can advance your research.
Corporate Headquarters
617 Davis Drive, Suite 100
Morrisville, NC 27560
Mailing Address:
P.O. Box 110407
Research Triangle Park, NC 27709

