Researchers face several challenges when it comes time to analyze their metabolomics data. Metabolomics analysis is a complex process that demands both biochemical literacy and data analysis capabilities. Few people have all the skills necessary to interpret the data. Once the data is delivered, data analysis is limited to external tools and can be underutilized, especially if the researcher is unfamiliar with the tools available or lacks the knowledge or experience to use them. This can lead to data analysis being extremely time-consuming.
With Metabolon’s new Bioinformatics Platform, you will have an increased ability to use your metabolomics data to gather insights. The Bioinformatics Platform reduces the complexity of analysis, improves time to insight, and reduces the cost of analysis. Data is integrated into tools that guide the user in understanding the biology behind their data uncovering hidden insights. Our integrated platform features tools centrally located to maximize efficiency for analysis needs. Since it is cloud-based, it will save you time on installing, researching tools, uploading, reformatting, and more. We are increasing the value of our overall product offering for the Global Discovery Panel by providing the Bioinformatics Platform at no extra cost.
Read more about the analysis tools provided by the Bioinformatics Platform below.
Principal Component Analysis (PCA): Examine Structure Within Your Data
PCA is the traditional approach to metabolomics visualization and serves as a straightforward means to assess the success of an experiment. It is crucial to confirm the accuracy of your foundational data before moving on to more advanced analyses. PCA is an intuitive way to confirm experimental success.
PCA offers stats to explore the structure of your data. Beginning with PCA can help you grasp the inherent data patterns and is often useful and necessary for quality control. Our bioinformatics platform makes this common analysis intuitive and interactive for users of all backgrounds.
Group Differentiation Made Easy: Uncover Hidden Patterns with Partial Least Squares-Discriminant Analysis (PLS-DA)
PLS-DA offers seven features to explore the grouped data. The user can begin to understand what the key metabolites and pathways driving the separation between their major groups are. Users can use PLS-DA to asses their model and can also use it to begin to answer basic research questions such as: How good is the prediction of the model? How much can you trust it? PLS-DA allows you to dive in as deep as you want.
Clustering Analysis: Unlock the Synchronized Dance of Your Metabolites
What metabolites or samples are being grouped based on the data? Our clustering analysis tool intelligently and automatically identifies the optimal grouping parameters, making the analysis more accessible. Shed light on the intricate relationships among samples or metabolites by revealing how groups of samples or metabolites are interrelated. Can those clustered metabolites be linked to pathways?
Hierarchical Clustering (HC) in Metabolon’s Bioinformatics Platform allows for the clustering of both metabolites and samples. This dual functionality is important for analyzing different aspects of metabolomics data. Clustering metabolites can reveal patterns in biochemical relationships and pathways while clustering samples can help in understanding variations across different conditions or phenotypes.
Cluster Embedding
Cluster embedding is for those who are comfortable with a more nuanced view of the data. This advanced technique goes beyond traditional hierarchical clustering, unearthing distinct patterns and subtypes within conditions or diseases that may not be apparent in raw data, offering a deeper, more nuanced understanding of your metabolomic analysis.
Cluster Correlation
Our pairwise clustering tool specifically focuses on individual pairs of samples or metabolites, revealing their direct relationships and interactions. This targeted approach offers a detailed view of the specific connections in your study, providing deeper insights into the unique dynamics of your research data.
Pathway Enrichment & Analysis: Illuminate the Biological Story Behind Your Data
Volcano Plot: Unveiling the Significance in Your Metabolomics Data
A powerful visual tool for identifying statistically significant changes in metabolite levels, the volcano plot tool balances the magnitude of change (fold change) against statistical significance (p-value) to spotlight the most biologically relevant metabolites for your study. Our tool allows you to easily focus on metabolites of interest and export high-resolution graphs for publication. The volcano plot also integrates with other tools. For example, a cluster found in the Clustering tool can be selected to show in a volcano plot.
Pathway Analysis
Pathway Analysis is a versatile tool for enrichment analysis and beyond. With multiple views ranging from simple to complex, this component not only provides traditional pathway insights but also paves the way for integrating advanced elements like gene associations and non-library metabolites. Our Pathway Analysis tool allows for the integration of genes and transcripts in the pathway view, providing a multiomic understanding of the data. It’s designed to offer a holistic understanding of pathways, bridging the gap between basic analysis and a deeper, more integrated view of metabolic interactions and functions in your research.
Biomarker Lenses: Zoom in on a Context of Interest
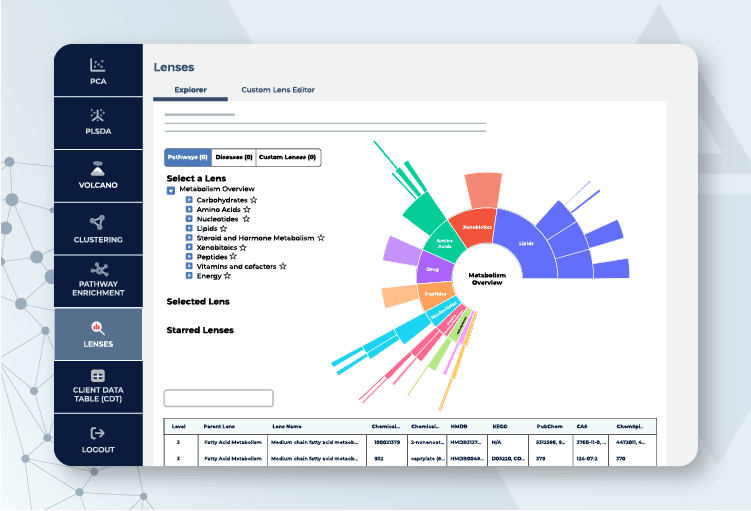
Biomarker Lenses describe a group of metabolites tied together by some shared characteristic, e.g., pathway, disease, or interest area. The overall purpose of Biomarker Lenses is to help you drill in on a biological context of interest. Metabolomics data sets are quite large and difficult to analyze. Biomarker Lenses™ act as a filter of metabolites and provide a starting point for you to view your data in different context windows by reducing complexity. The ’Custom Biomarker Lens™’ feature allows you to create your own context based on your interest. You can create a Lens based on your favorite metabolites or any other criteria you choose. ’Custom Biomarker Lenses™’ can be saved and reused across studies to look at cross-study functionality.


